TECO Drainac® Freeness Analyzer
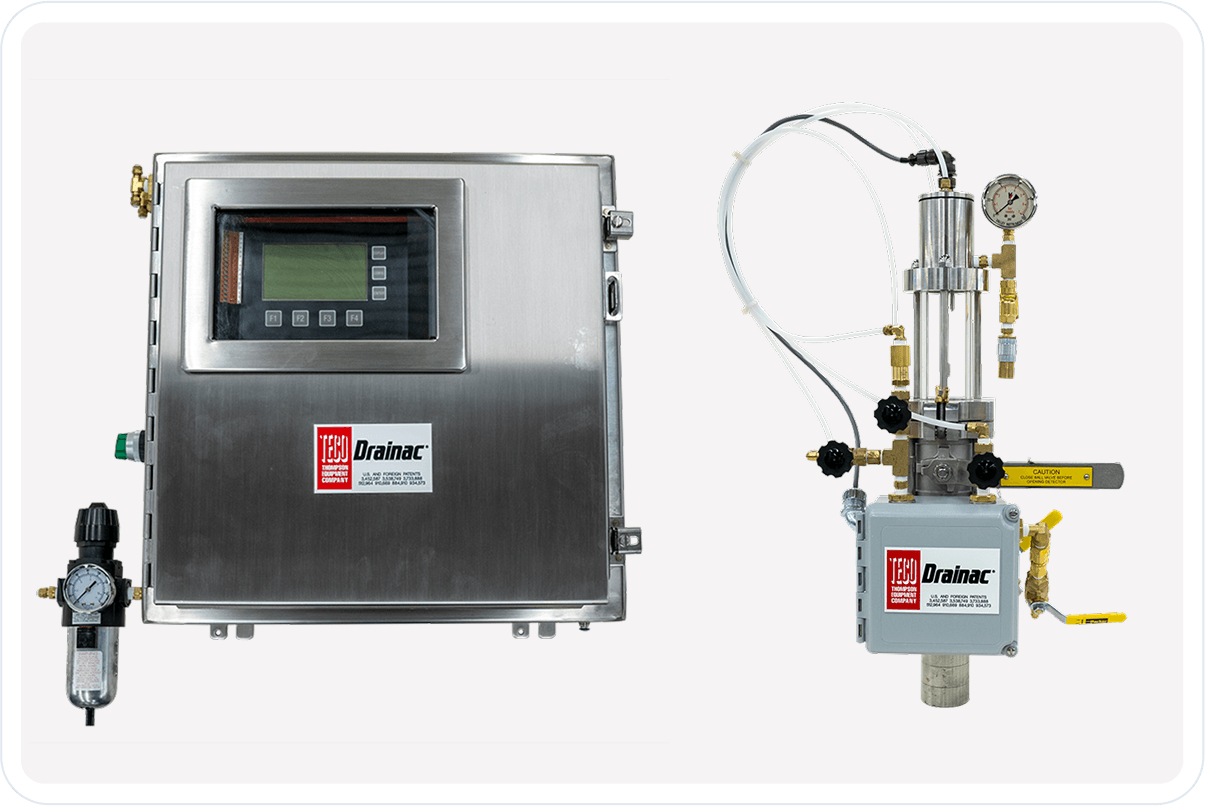
The Drainac® is an online freeness analyzer that directly measures drainage rate (freeness) in papermaking. It consists of a sample system and controller with optional back-flow preventer.
Product Summary
Download Product Summary SheetDrainac® Freeness Analyzer Product Information Review
Product Overview:
The Drainac® Freeness Analyzer is an on-line, in-process field instrument used as a production orientated tool that directly measures drainage rate (freeness).
How it works…
The Drainac® operates on the basic principle of how easily water will drain through a pad of fiber. Approximately every 30 seconds, the Drainac® measures the rate of filtrate flow through a fiber pad.
The Drainac® consists of a totally enclosed vertical riser which has no moving parts. The compact detector is mounted directly in a pressurized stock line, or open vessel, avoiding any sampling lags or transport delay time. For pressurized applications, stock rises into the detector tube under controlled differential pressure. Fibers are retained on a perforated plate and filtrate passes through the pad which is formed. The time required to draw a known volume filtrate through the pad is used to calculate freeness. For non-pressurized applications, the Drainac® employs negative pressure to draw the stock sample into the detector tube for drainage rate determination.
Once the freeness has been determined, air pressure is increased to return the filtrate and fiber to the stock line in preparation for the next cycle. At the same time, flush water is introduced into the chamber to clean the screen and interior of the chamber. Cycle times range from 30- 60 seconds.
Who is it important to?
Production Superintendent / Machine Superintendent / Process Engineers / Machine Operators…. Anyone who has basic paper machine production responsibility.
Why is it important?
This unit is used as a production orientated tool to give a fast, on-line freeness measurement.
This information is regarded as a “window” into the process as an indirect measurement of fiber quality.
Competitive Advantage: the Drainac® is the only freeness measurement device that actually measures the true drainage rate, or from the papermaker’s standpoint, actually measures the drainage of the stock on the forming fabric.)
This on-line process signal then can be used for closed-loop refiner controls and real-time stock blending decisions.
Key Features / Benefits:
Fast Sample Rate – 2-3 samples / minute allows for superior refiner control performance.
Directly Measures Drainage Rate – calibrates to any freeness measurement, CSF, Williams Precision Slowness, Schopper-Reigler.
Complete In-line System – no wasted product or sewered samples.
Multiple Calibration Characteristics – for applications with different grades or furnishes.
Self Cleaning System – minimizing maintenance and sampling errors.
Simple Design – easy to use and understand.
Low Installation Cost – the simple design allows for easy, cost effective installation.
Digital Communication – easily integrates into any DCS platform.
Applications
Closed Loop Refiner Controls
On-line freeness measurement is commonly used to control the final freeness target (setpoint) for the refiners by cascading the freeness measurement output directly to the horsepower tons / day controller.
Basic On-line Freeness Measurement
Basic on-line freeness measurement is used by production managers and paper machine operators as a “speedometer” of fiber quality enabling them to make real- time decisions that effect final production quality and paper machine runnability.
Stock Blending
Used for monitoring the fiber characteristics of individual furnish streams so that optimal stock blending can be accomplished on a real-time basis. In this manner, the lower cost furnish stream can be maximized without sacrificing final product quality.
Specifications
Download Spec SheetSensor
| Sample Rate | 2-3 samples per minute typical |
|---|---|
| Pressure | Stockline (10-90 psi), LowPressure Unit (0-25 psi) |
| Stock Velocity | 0.1 - 10 ft./sec |
| Freeness | 0 - 800 CSF, 10 - 90º SR, Williams Precision Slowness, 0-300 se Drain Time |
| Consistency | 0.5 - 6.0% (readily adaptable to other consistencies) |
| Water | Min 10 psi above max stockline pressure. Average consumption: 0.3 gpm |
| Air | Min 10 psi above max stockline pressure. Average consumption: 1.5 scfm for stockline units, 12.5 scfm for other units. |
| Probs | 316SS (Standard) other materials available |
| Flush Points | Top of chamber spray, over screen spray, and below screen flush |
Transmitter
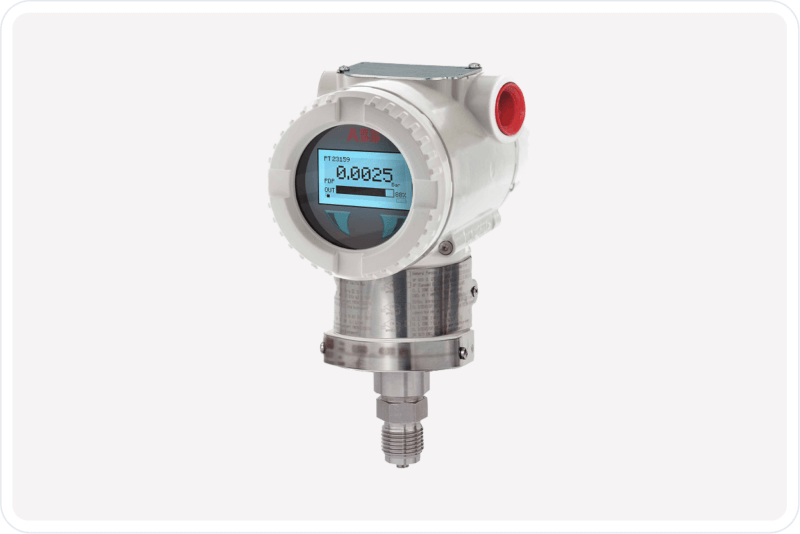
| Display | Variable contrast graphical LCD |
|---|---|
| Electronics | Microprocessor based |
| Analog Input | (1) 4-20 mA fro active compenstation |
| Analog Output | (1) 4-20 mA for compensated freeness |
| Communication | (1) full duplex choice of protocols: RS 232 / IEEE 422 / IEEE 485 |
| Calibration | Computer guided process samplign and internal parameter calculation. |
| Recipe Memory | Retains (10) ten settings and calibration parameters |
| Enclosure | NEMA 4X |
Accuracy Statement
Download Accuracy StatementThe Drainac measures the Drain Time of the stock. It does so with a very high degree of repeatability, meaning that if you were to present the same stock to the Drainac over and over, you would get an analysis that would have a statistical variability of less than 1%.
Most customers, however, when they ask how accurate the Drainac is, are actually asking how accurate the Drainac is with respect to a CSF analysis produced by their laboratory. In other words, if the lab reads X freeness for a sample, what might the Drainac read for the same sample?
This is a more complex questions than it seems, primarily because the Drainac does not perform a CSF analysis. It performs a Drain Time analysis. To get a reading in CSF units, one must build a calibration between the native drain time measurement of the Drainac and the CSF evaluations produced by the customer’s laboratory.
This calibration is a mathematical relationship which is derived by comparing lab CSF evaluations of samples with the Drainac drain time readings made when the samples were collected.
This calibration relies entirely on the accuracy of the laboratory performing the CSF freeness evaluation. The statistics of those evaluations will define the accuracy of the Drainac with respect to future lab evaluations of sample freeness.
If the lab is very good, it will have very tight statistics, i.e., a small two-sigma (2σ). In such circumstances, there should be good general agreement between the lab and the Drainac and any differences between the two will be small. If the lab is not so good, then the differences will be larger. In either case, it is important to have an estimate of the laboratory analysis statistics, specifically the 2σ of the CSF test as performed by the laboratory.
If the calibration is executed properly, and the statistics are well defined, one would expect that 95% of the time, the Drainac evaluation and the lab evaluation would agree with each other within the bounds defined by the 2σ limits of the laboratory. The residuals should have zero mean.
Of course, occasionally, they will not be in that range, but that is not cause for concern unless the deviation is systematic. Examples of systematic deviations might be evaluations whose values lie consistently outside of the 2σ range, or residuals the mean of which are consistently positive or negative.
In the case of systematic deviation, it may be necessary to recalibrate the system, or re-estimate the statistics of the lab, or both.
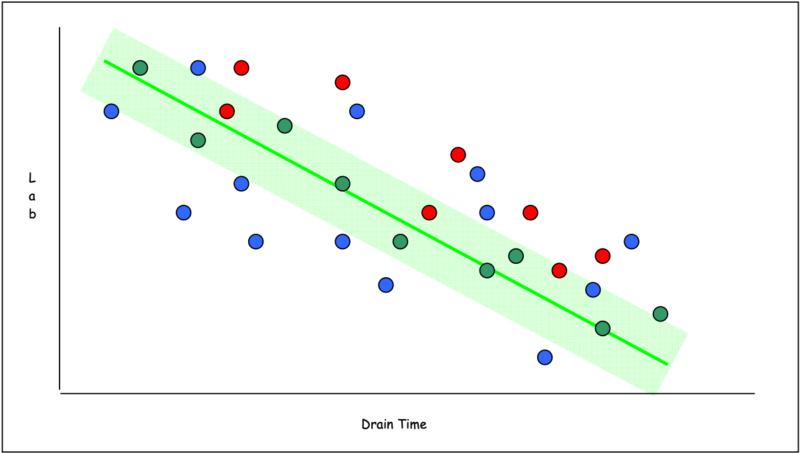
In the figure above, the green line represents the best fit calibration line developed by regression of laboratory and Drainac data. The shaded green area represents the 2σ limits of acceptable variation as defined by the statistics of the regression.
The green points are examples of Lab-Drainac data pairs that are mostly within the acceptable region of variation. Although one of the green data points in the example actually lies outside of the acceptable variation, the bulk of them are within the area, and one would conclude that the lab procedure, the Drainac system and the calibration are functioning properly.
The blue points are examples of Lab-Drainac data pairs whose values consistently lie outside of the area of acceptable variation. This may indicate that the original calibration statistics are no longer valid, or that something has changed, either with the lab methodology or the Drainac instrument. A review of both systems and the calibration is in order.
The red points are Lab-Drainac data pairs which are showing a consistent bias on one side of the best fit line. Even though some of the data points are still within the green shaded area, a review of the calibration, lab method and instrument are in order.
Documents
| Product Summary | Download | |
|---|---|---|
| Specifications | Download | |
| Accuracy Statement | Download | |
| Drainac® Customer Application Data Sheet | Download | |
| Calibrating your Drainac® | Download | |
| Drainac® Calibration: Pressure Settings | Download | |
| Drainac® Calibration Repeatability vs. Accuracy v1.0 | Download | |
| Using Drainac® Drain Time in a DCS | Download | |
| Importance of Cleaning Your Drainac® | Download | |
| Drainac® Stock Blending | Download | |
| Drainac® Refiner Control | Download | |
| Drainac® IIIB Online Freeness Analyzer Operations Manual | Download |
Related Products
TECO Drainac® Plant Utility Integrity Monitor (PIM)
The Plant Utility Integrity Monitor (PIM) is a Drainac® accessory that monitors both stockline and plant air supply pressures and protects the Drainac® from back-flow events.